As part of the MSc course I’m currently undertaking, there’s a great need to understand optimality of processes and operations. One of them is the problem of queues while serving customers. The following is my submission for the assignment of the Simulation (MATH110281) course.
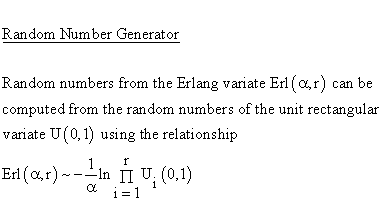
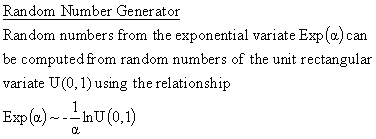
The deliverable of this course was to simulate a simple bank queue with three scenarios. The first scenario was single server (employee serving customers) and an exponential random time of arrival and an Erland random number of completion. Both these numbers were derived from Java’s Random class. The myRandom class, included in the public Git repository2, and it was created by my lecturer Andreas Grothey. It is basically an implementation of generating an erlang variate Erl(λ, μ) and en exponential one Exp(μ), from a uniformly distributed Gaussian distribution3.
For this assignment, different scenarios for managing a bank queue were requested from the bank manager. The first scenario involved a queue with single server with an exponential distribution for arrival. The average of customers arriving was 19 per hour. The completion times were given by an Erlang distribution. The number of customers served per hour were 20. The day in all simulations was taken to last 8 work-hours. The result of this scenario was that out of 164 arrivals, all customers were served with 85.4% (140 customers) having waited more than 6 minutes in the queue.
The second scenario involved extending the queue to multiple servers. An ArrayList was used to keep track of servers’ status and time of completion. This scenario produced non optimal results, since there ware 22.8% of customers waiting more than 6 minutes. The maximum queue for this scenario was 17 customers.
The third and final scenario was to implement different average numbers of customers for each of the 8 hours in the work day. The additional decision was to implement a strategy of opening and closing server positions when demand increases. The demand criterion was selected to be the length of the queue at any given time. There were different scenarios to try out, but the sole setting that met the constraint was when the queue did not exceed 6 customers.
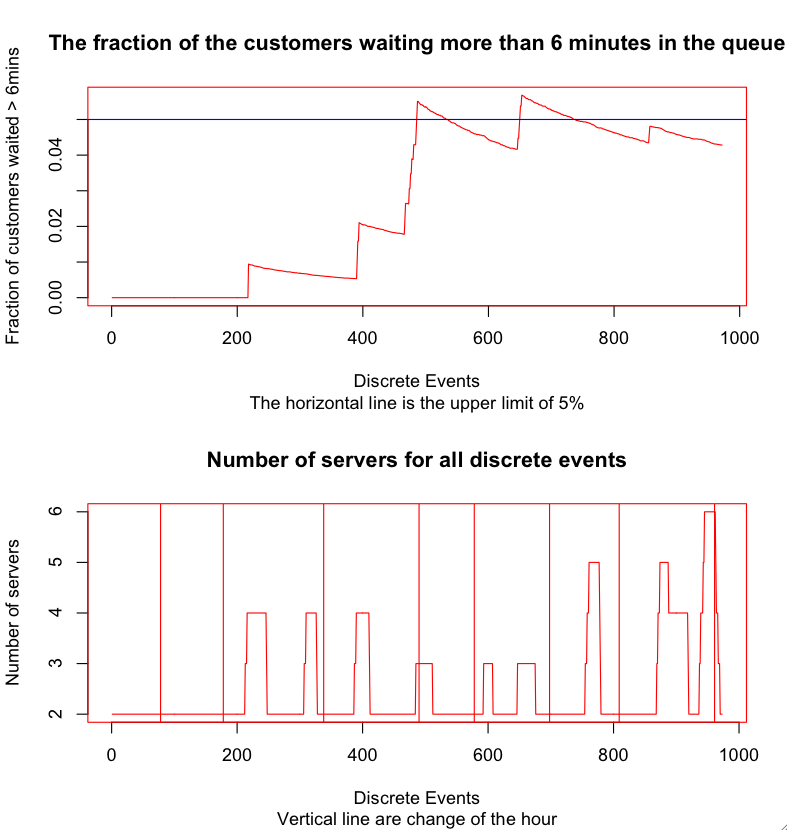
The plots above were generated with R4 after out-putting the Java stdout to a file called “fraction”. From there the contents of that file were passed though awk in order to sieve the fraction values from all other data into a file called “fraction2″. The latter file was used as the dataset in R. The history for the commands used in R are here.
The figure above shows at the top part, the procession of the fraction throughout the day. The blue horizontal line is the constraint ceiling of 5% (0.05).
The results for this scenario were run over 100 trial iterations, in order to calculate an average value for the percentage of customers that wait more than 6 minutes in the queue. This value was resulting at 3.2% ;well within the limit. If the queue tolerance was extended to being more than 7, the average fraction was outside the limit of 5%.
The two diagrams show the time-series of the fraction of customers waiting more than 6 minutes (top) and the number of servers that are engaged at each discrete interval. The red vertical lines are indicating the events at which the hour changes. Therefore they denote the 8 1-hour segment during the day and the servers corresponding to each hour. It is evident that the third, fourth, seventh, and eighth hour of the day demanded the most servers.
An average value of servers per event is also outputted as a means of showing the hours in most need of additional servers. Again the hour slots mentioned above stand out as the highest values.
Avg servers for hour 1 : 2.0
Avg servers for hour 2 : 1.98
Avg servers for hour 3 : 2.641509433962264
Avg servers for hour 4 : 2.323529411764706
Avg servers for hour 5 : 2.25
Avg servers for hour 6 : 2.3307086614173227
Avg servers for hour 7 : 2.580952380952381
Avg servers for hour 8 : 3.278787878787879
The result of the simulation indicates that the bank will require a minimum of two people per hour for all hours of the work day, aside from the end-of-day hour (16.00-17.00) were an additional employee will be required a the service tills.
Footnotes
1.
The structure of Simulation course I sat through. This is here mainly to give people an idea as to what is expected from this course.
Aims:
Many Management problems are far too complex to be solved solely by Mathematical Analysis. Simulation (Monte-Carlo) methods were developed during the Second World War to solve difficult problems in Mathematical Physics. This module shows how discrete event simulation is increasingly used to investigate the behaviour of complex stochastic systems in Management. The course includes hands-on construction of simulation models using the package SIMUL8.
Syllabus summary:
Generating Uniform random numbers using Linear Congruential methods. Tests of randomness including Frequency and Serial tests and Lattice behaviour. Generating Random Variates from distributions: Inversion of the cumulative distribution function and Envelope Rejection methods. Generating variates from standard distributions including normal, gamma, beta, Poisson, binomial. Theory and simulation of Poisson and other birth-death processes. Discrete event simulation: Entity, Event, Activity, Attribute, and Set. Event and Three-Phase approaches to model construction. An example in JAVA. Design and analysis of experiments: Use of random number seeds. Variance Reduction including Antithetic and Control Variates. Analysis of autocorrelated output data. Use of the SIMUL8 package to build and experiment on models of manufacturing and management systems. Project work for continuous assessment part of course.
Back to post.
2.
You can clone, fork, review this code at:
https://github.com/cmdel/Queue-Simulation
git@github.com:cmdel/Queue-Simulation.git (For cloning in Eclipse or the command line)
3.


4.

